It is a cliché to mention, but also very true that monitoring, observability and tracing of data and events is of critical importance when managing the components of your Amazon Cloud infrastructure. I am a huge proponent of engineering teams investing heavily in the monitoring of their applications and infrastructure on the AWS cloud – this means having the full infrastructure in place to collate logs, extract and transform their data and shipping them to a service like OpenSearch for real time dashboards, alerting and debugging and the all important searchability of your log data – all good stuff I plan to write about in this blog.
But reality of existing applications means we may not have all that monitoring, indexing and searching infrastructure in place, at least not for everything in our cloud infrastructure – and we may have to fall back on some more primitive options, like reading logs!
On that point though, if you have a single application server and are able to ssh onto the server and tail or grep the log output to consistently get to the root of a problem, it is one thing. But more often than not, at scale with multiple servers or when using discreet services like Lambda logs or other AWS services like AppSync, you will probably have to rely on Amazon’s CloudWatch Logs (assuming this is without an ELK stack process in place). And if you have any familiarity at all with manually reading through your CloudWatch logs – you know this at best a tedious process and more likely an exercise in futility.
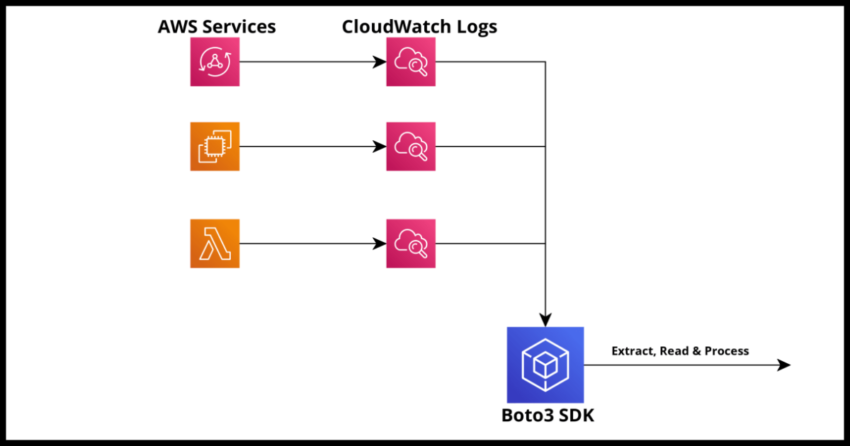
AWS SDKs, like the Boto3 SDK for Python, provide an easy way to extract and read CloudWatch logs – a simpler and much faster alternative if we don’t have an immediate way to index logs in a specialized service. I will demonstrate that process in this article, but first some context for the benefit of anyone interested. Skip ahead to the next section to dive straight into the code.
CloudWatch Logs – The Good and the Bad
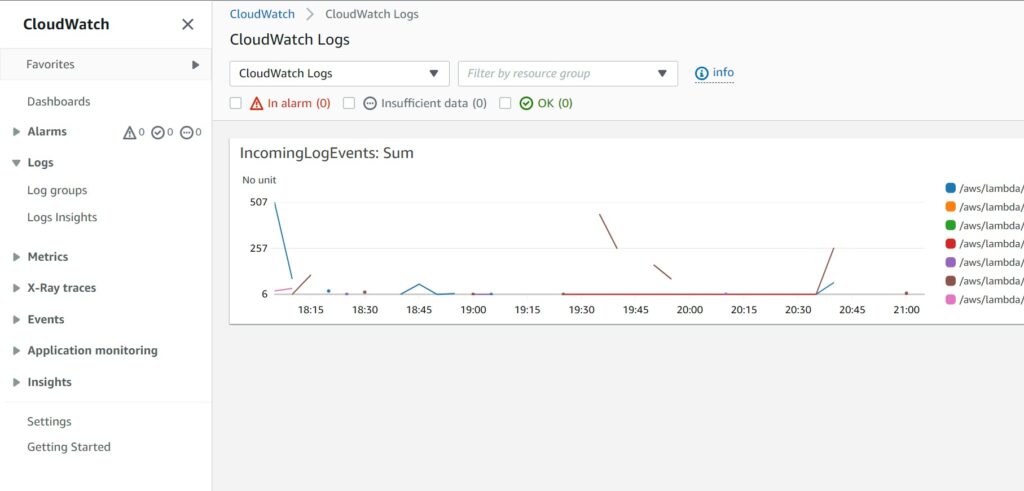
Straight off the get go – I want to stress that this isn’t a complaint about CloudWatch. It is an absolutely great service that AWS provides and really critical when you work heavily with serverless applications. For no additional setup or wiring work required on your end, you essentially get a free console logging output stored for you that you can both read your logs and even get detailed metrics on. For quick “development” of your Lambdas, you will probably be initially testing them directly by monitoring your first runs of your service in their CloudWatch Log Groups.
And even for other AWS services you can often control aspects of how much system generated levels of log data you want stored. Like this below example for AppSync log levels.
AppSyncGraphQLApi:
Type: "AWS::AppSync::GraphQLApi"
Properties:
Name: "GraphQLApi"
AuthenticationType: "AWS_LAMBDA"
LambdaAuthorizerConfig:
AuthorizerResultTtlInSeconds: 0
AuthorizerUri: !GetAtt AppSyncAuthorizer.Arn
LogConfig:
CloudWatchLogsRoleArn: !GetAtt AppSyncRole.Arn
ExcludeVerboseContent: FALSE
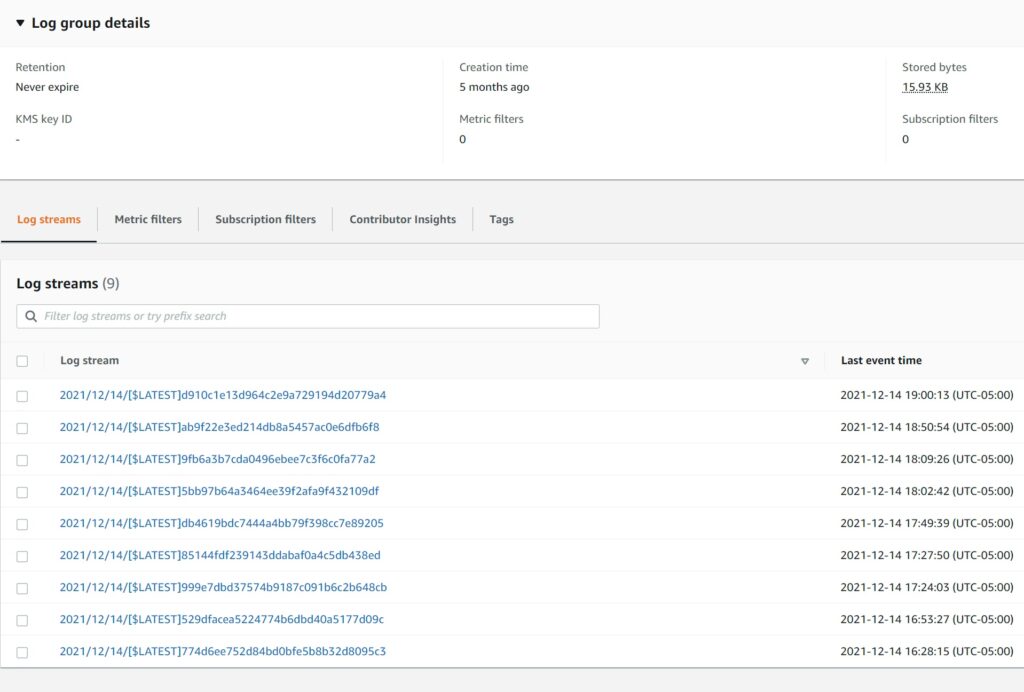
FieldLogLevel: ALLAnd all your logs are collated and generated in individual instance, size and time bound extracts of log data called LogStreams under each CloudWatch Log Group again the collation of which is entirely managed by AWS CloudWatch.
All great – but the image above highlights some of the shortcomings of CloudWatch – namely it is **not a replacement for a true Log Indexing Monitoring solution ** like OpenSearch service – which is incidentally Amazon’s fork of the original ElasticSearch service.
1. It is good for a quick look at the most recent logs, but becomes very hard to look for logs going back in time
2. Its search feature is limited and slow
3. It becomes very hard to work with large amounts of data within a single log stream
4. It is very hard to know which specific log stream you need to load to see the relevant logs
Just to list a few problems with manually traversing CloudWatch – all of which are not a problem of CLoudWatch because it is really an intermediate layer from where you can extract and transform your log data for a more enriched monitoring experience with a specialized service. But that takes time – here is a quick and simpler way to read CloudWatch Logs using Boto3 and Python.
How to extract CloudWatch Logs using the Boto3 SDK
Prerequisite – Setting up your local enviroment
To get this code below to run locally, you will need setup your local AWS Credentials in a credentials file in a .aws folder locally depending on your OS.
While the topics are for different guides, I have some articles that demonstrate this setup – see the first section regarding local credentials file setup which might be sufficient for you. If not there are detailed guides elsewhere online but I unfortunately don’t have one written yet.
How to Deply a Cloudformation Template with AWS SAM
Setting up Multifactor Auth for AWS CLI
You will of course also need Python and Boto3. I am assuming you have Python if you reading this article – just in case you don’t have Boto3
pip install boto3Demonstrating the Code
The code is really simple, but of course the complexity of the process depends on what it is you want to extract from your logs.
The most important thing is connectivity to your AWS environment – you will need a profile setup in your .aws folder credentials file with your IAM access token, basically in the Boto3 SDK you will need to supply a connection to your access token for the SDK to use to create a connection session to connect to any AWS service – in this case CloudWatch.
Also a reminder – your AWS IAM access token must have sufficient permissions to read CloudWatch Logs. You will need this to test it out and you can do so with a free account for yourself personally if necessary.
aws_connection = boto3.session.Session(profile_name="your_local_credentials_profile")
#aws_connection = boto3.session.Session() <-- this will use the default credential if you have a [default]
Once you have a Boto3 session, you connect to the appropriate AWS service using either the SDK client or a resource in the case of certain services like DynamoDB tables. For CloudWatch the service client is “logs”.
cloudwatch = aws_con.client('logs')The rest of the code should be self explanatory – but I will briefly review it below.
import boto3

aws_connection = boto3.session.Session(profile_name="profile_name")
cloudwatch = aws_connection.client('logs')

log_group_to_scan="/aws/lambda/YourLambdaName"
log_stream_filter_prefix="2022/05/07/"

try:

    response = cloudwatch.describe_log_streams(logGroupName=log_group_to_scan,
                                               descending=True,
                                               logStreamNamePrefix=log_stream_filter_prefix)

    for logstream in response["logStreams"]:

        logstream_name = logstream["logStreamName"]
        print(f"Extracting logs for stream {logstream_name}")

        log_details = cloudwatch.get_log_events(
            logGroupName=log_group_to_scan,
            logStreamName=logstream_name,
        )

        for event in log_details["events"]:
            timestamp = int(event["timestamp"])
            message = str(event["message"])

            print(f"{timestamp}:{message}")

except Exception as e:
	print(e)
The code scans for the log steams under the desired log group with a filter setting of descending order by timestamp and also for only the logs for the particular date provided as the prefix. The rest of the code demonstrates how to extract each message in the log along with the timestamp.
From here, we can run whatever logic we need such as searching for certain bits of information or running a count against a certain event – all the kind of stuff we can quickly get done if we don’t have the logs indexed.