Lambda Layers are used for more than just making shared classes, packages and libraries available across your Lambda functions. You can for instance share a custom runtime for your serverless Lambda function to execute in if your default AWS supplied runtime is insufficient for your particular function. But sharing common utilities and other common code like custom objects or configurations are probably the most common use case with Lambda layers. This article provides such a sample utility – a JSON format based logging class in the Python programming language that makes use of the excellent json-logging library and adds a little custom functionality like timing calculations.
I personally use versions of this coding example by default for logging in most of my Lambdas and is usually a part of my CloudFormation stack globals
Globals:
  Function:
    Runtime: python3.9
    Layers:
      - !Sub "arn:aws:lambda:${AWS::Region}:${AWS::AccountId}:layer:utility-cloudwatch-json-logger:1"
This way, I have access to the layer function to log in JSON format across my Lambdas in the stack and using it is quite easy as I will demonstrate in this article.
Jump to the section below to dive straight into the implementation details if you know all about the benefits of logging in a JSON format, but I do want to discuss the reasons why first for the benefits of anyone interested.
Why log in a JSON format (and why you really should always do this!) ?
To touch on some commonly understood points about logging – it is generally necessary, it can help identify problems, aid debugging, help investigate events, trace workflows – a whole load of stuff. There are philosophical arguments on how much logging one should and should not do and other debates and considerations about logging best practices and all that – I have my own opinions of course but that is not being discussed here.
There are two realities with logs with relation of cloud based micro service architectures as most serverless systems typically have-
1. There is usually a lot of logs – even when there isn’t a lot of activity, this design by its nature triggers a flow across multiple discrete service parts
2. Correlating and tracking logs across all these systems is necessary – it is typically not possible to manually track flows across individual logs beyond a certain scale.
And even if you have a monolithic application – depending on the number of functions within it and volume, manually tailing a log can be a nightmare.
Fortunately, the solutions for these problems of Log Collation, and searching across all of them, perhaps even with nice visual dashboards and graphs and all are many – look at OpenSearch with its Kibana dashboard or perhaps DataDog – both which I plan to be writing about in the near future – but that is a separate discussion.
Now what do all of these solutions really expect to make the most of their best features – collated, indexed and searchable logs from which you can build out dashboards and reports and all?
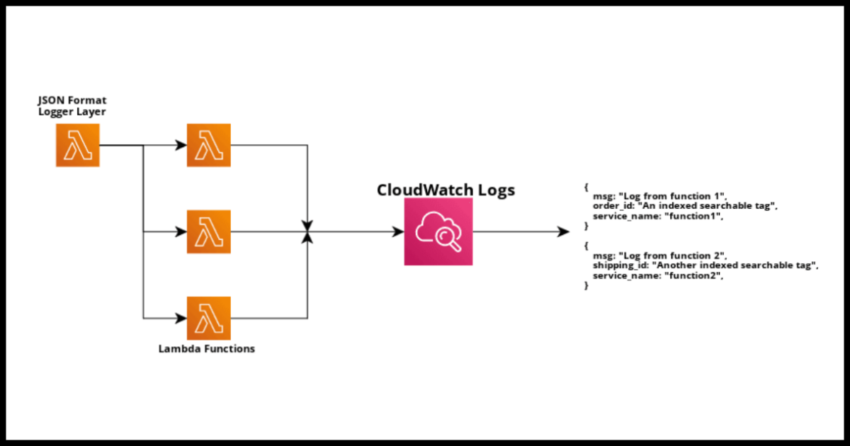
JSON Format Based Logging
That is correct – all of these services that uses underlying frameworks to index your logs require JSON formats to work. Even if your logs are not generated in JSON format by default – there is a necessary transformation step ( the LogStash part of the famous ELK stack acronym if you are familiar) before they are fully consumed.
While there are great tools – you can bypass the hassle of building and maintaining transformation logic by directly logging your data in a JSON formation to begin with! You can define indexable tags, for example – order id/service name in an ecommerce application and trace the id across your services of workflows.
Hypothetically, this would look like this…
logger.log(f"New Order:{order_id}", ORDER_ID=order_id, SERVICE_NAME="OrderEntry")
...
...
logger.log(f"Order Shipped:{order_id}", ORDER_ID=order_id, SERVICE_NAME="ShipProcessor")
..
..
logger.log(f"Order Billed:{order_id}", ORDER_ID=order_id, SERVICE_NAME="Billing")
And now you can have easy traceability using a service of your choice without any additional difficulty other than using log statements you probably would use anyway. The only minor additional burden is defining those tags you want to search with.
This is a beneficial no matter your environment – but this article will demonstrate a tool specifically for working with Lambdas from where the logs can be shipped from CloudWatch to a service of your choice.
A quick word on Lambda Layers and deploying them
This is not covering the basics of Lambda layers – its basically a deployed package available to your Lambdas (depending on the runtime) that can be used. A logger library like the one I am going to demonstrate is a great example for use as Lambda layer as all the Lambdas can simply reference it as use it – like I demonstrated above using the CloudFormation Globals property to make a particular jsong logger layer available.
A Lambda layer can be coded a zipped and manually deployed via the console – or if you prefer to have Infrastructure-as-Code template definitions:
AWSTemplateFormatVersion: '2010-09-09'
Transform: AWS::Serverless-2016-10-31
Description: JSON Format Logger

Resources:
  UtilCloudwatchJsonLogger:
    Type: AWS::Serverless::LayerVersion
    Properties:
      LayerName: utility-cloudwatch-json-logger
      ContentUri: ./utility-cloudwatch-json-logger
      CompatibleRuntimes:
        - python3.9
    Metadata:
      BuildMethod: python3.9
Which can then be built and deployed.
Now to code the layer in Python
Coding the JSON Format Logger Layer
First – a word on what this utility does on top of what we can use out of the box with the really excellent json logging library that it is using.
We want to start the function with a couple of required fields: Service Name & Application Name – so we know the service which is part of a larger application. If not, they can be the same name. The utility will not supply these indexable tags automatically and we do not need to log it all the time and will log the start generically for you
We want to end the function – again without writing generic code statements – the utility will log it for you.
We want to calculate some metrics – While CloudWatch collects metrics on a per Lambda level – this offers some granularity to automatically time blocks within your Lambda.
We want to log exceptions and of course regular logs.
This can of course be easily extended as suits your particular application especially with regards to additional helpers and log levels.
Lets code this out in Python.
import logging
import json_logging
import time
from datetime import datetime

class Logger:

    def __init__(self,
                 service_name: str,
                 app_name: str
                 ):

        self._logger = logging.getLogger(service_name)
        self._logger.setLevel(logging.DEBUG)
        self._logger.addHandler(logging.StreamHandler())

        json_logging.init_non_web(enable_json=True)

        self.service_name = service_name
        self.app_name = app_name

        #This is for sending custom index tags like order_id
        self.props = dict()

        #This is for calculating timed operations
        self.op_stats = dict()

        self.props["APP_NAME"] = app_name
        self.props["SERVICE_NAME"] = service_name

        self._logger.info(f"Logger for Service {service_name} of {app_name} initialized.", extra={"props": self.props})

    def log(self, message: str, **kwargs):
        self._logger.info(message, extra={"props": dict(**self.props, **kwargs)})

    def log_exception(self, message: str, exception: Exception, **kwargs):
        self._logger.exception(message, exc_info=exception, extra={"props": dict(**self.props, **kwargs)})

    def log_start(self):

        self._logger.info(f"Module {self.service_name} of {self.app_name} "
                          f"started processing.", extra={"props": self.props})

    def log_end(self):

        self._logger.info(f"Module {self.service_name} of {self.app_name} "
                          f"stopped processing.", extra={"props": self.props})

        self.props = dict()
        self.op_stats = dict()


    def log_op_start(self, op_id: str, **kwargs):
        self.op_stats[op_id] = time.perf_counter_ns()
        op_start = datetime.now().isoformat()
        self._logger.info(f"Tracking {op_id}",
                          extra={"props": dict(**self.props,
                                               op_id=op_id,
                                               op_start=op_start,
                                               **kwargs)})

    def log_op_end(self, op_id: str, op_name: str, **kwargs):
        operation_end_time = datetime.now().isoformat()
        if op_id in self.op_stats.keys():
            end_time = time.perf_counter_ns()

            start_time = self.op_stats[op_id]

            duration_nanos = end_time - start_time
            duration_millis = duration_nanos / 1000000
            duration_secs = duration_millis / 1000

            self._logger.info(f"{op_id} completed.",
                              extra={"props": dict(**self.props,
                                                   op_id=op_id,
                                                   op_start_time=start_time
                                                   op_end_time=end_time,
                                                   op_duration_millis=duration_millis,
                                                   op_duration_secs=duration_secs,
                                                   op_duration_nanos=duration_nanos,
                                                   **kwargs)})
This code should be self explanatory however rather than review each method – I think it is best demonstrated by an example with a Lambda.
Using the JSON Format Logger Layer in a Lambda
Now I have already demonstrated how to create a layer and reference via cloudformation.
If using the console – simply navigate to the Layers section of your Lambda and select it from the dropdown.
Note of course the runtime needs to be compatible – in this case Python.
Now within your code, using it is very simple.
from utility_cloudwatch_json_logger import Logger

logger = Logger(service_name="SampleLambda", app_name="SampleApplication")


def lambda_handler(event, context):

    logger.log_start()

    try:
		order_id = "Test123"

        logger.log(f"Yet Another Order:{order_id}", ORDER_ID=order_id)

        log_op_start(op_id="op1")

        logger.log(f"Doing Operation on Order:{order_id}", ORDER_ID=order_id)

        log_op_end(op_id="op1")

    except Exception as e:
        logger.log_exception("BOOM!", exception=e)
    finally:
    	logger.log_end()
And thats that.
Where from here?
Once you have a sample Lambda logging in Python format – you aren’t going to see any immediate benefits if you are simply looking at CloudWatch.
We need to ship these into an OpenSearch index or some other service like DataDog.
These will be future articles on this blog – but this covers the basics for that next step.